Most electrical knowledge in the FSAE community is relatively limited, especially in simulation. Although most teams have Ansys sponsorships (which give full access to the EM suite, including SIWave), they only use them for mechanical sims! It turns out that simulating current density in battery nickel strips is a pretty straightforward application of DCIR simulation tools - if you’re an EE member on a different team, try it!
As a disclaimer, I don’t actually know much about batteries, and only did these sims / help with the nickel strip design. You can hit up Ramiro or Mia for more.
Background
Most FSAE electric teams use lithium ion cylindrical cells, which are stacked and connected together with nickel strips (very thin nickel plated copper). The arrangement of the nickel strips is used to create a MsNp (m cells in series, N in parallel) configuration of cells to build up to the right voltage (via the series route) with the necessary maximum current output (determined by the parallel count and cell discharge rate). Usually the pack is also broken up into a few identical modules for easier assembly and repair.
The focus of this post is discharge uniformity. Assuming all cells have the same characteristics, we just need to look at a single parallel count. High discharge on a single cell will increase its heat dissipation. Additionally, FSAE packs are required to have fusible links (parts of the nickel strip that are skinny and act as fuses) as a failsafe for unexpected transient current events. The tripping point of the pack is then limited by that of the first link to blow, so unequal discharge can cause a single fusible link to sustain more current than expected and to blow earlier, artifically reducing the maximum sustainable current of the pack. Blowing a fusible link practically takes out the battery module in the pack, which takes a lot of work to replace (if even possible to replace).
We plan on running our battery without cooling and want it to last at least two years (a lot of cycling), so it’s pretty valuable to get the discharge thing right.
You can do some rudimentary hand calcs to prevent this imbalance between cells by approximating resistances of the strips, but that itself is difficult and unintuitive with weird goemetries. Much easier with simulation.
Simulating
A lot of teams have ansys sponsorships, and SIWave is a cool tool to do DCIR simulations. Setting it up is really simple for something with a few terminals like this. Make a board with the strip as a polygon and with large pads on each tab for SIWave to identify:
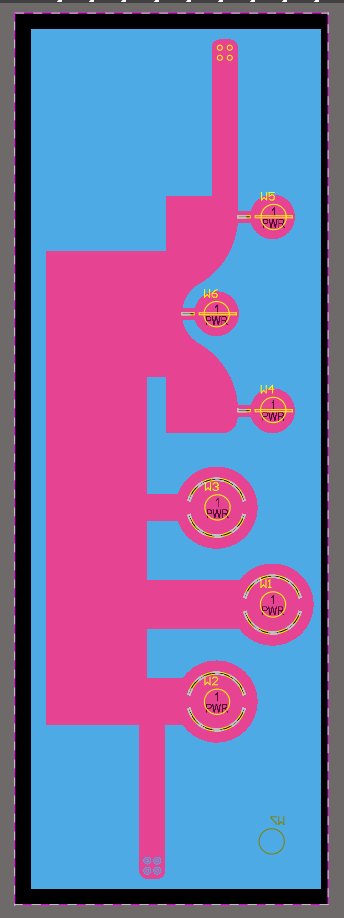
You need a ground layer to act as a reference. In SIWave, define voltage sources and currents on the positive / negative sides of the strip, using the ground as reference. The source values can be arbitrary (just comparing relative current density) as long as they’re the same. Also, add an equipotential zone on the ground plane since it doesn’t actually exist. Run the DCIR and select current density, and set the scale to linear:
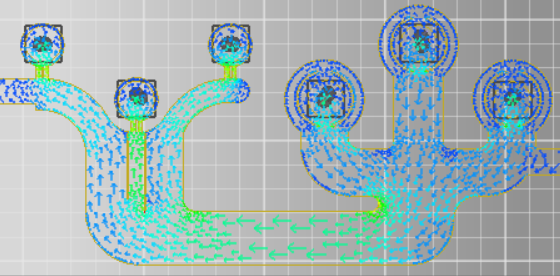
This nickel strip is making a “U” between two parallel groups of three cells each. The top three cells are positive (voltage sources on each tab there) and the bottom three are negative of the next group (current sources). The reason we can compare current densities is because we use the same geometry for the fusible links on each cell:
Analysis
First version
Looking at the plot above, the discharge is pretty imbalanced; sarting from the top, the discharge ratio is roughly 1:2:1.2. This is a clear proxy for power dissipation:
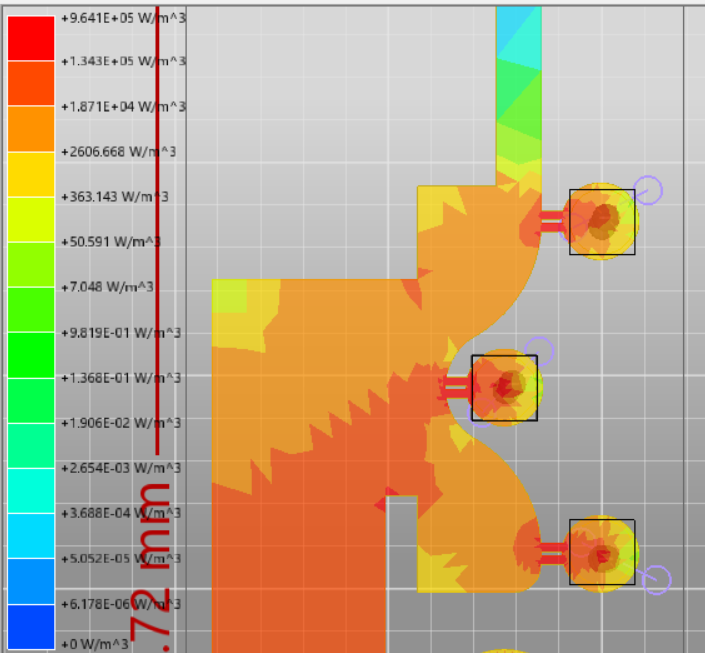
Note that the sim also shows the fusibile links working, since those dissipate the most power.
A cool observation that the relative discharge rates shows you is how much of the battery capacity shifts within the pack while it discharges. While experimenting with different geometries, we found that it was pretty easy to get all but one cell to discharge uniformly, so let α be the relative amount that cell discharges with respect to the other two. Then for N cells (the two cell thing probably doesn’t generalize, whatever) the capacity shifting around is:
\[1-\frac{N-1+\alpha}{N\alpha}\]Using the numbers above (say the ratio is 1.1:2:1.1) that’s 30%!
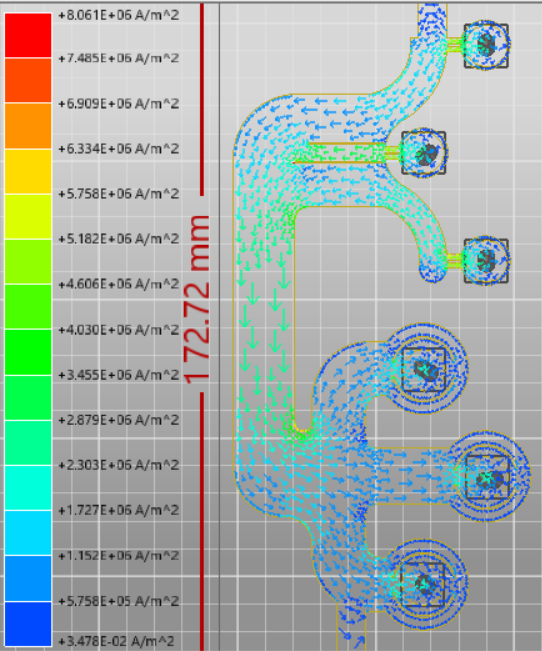
From the plots, you can also see that the sharp corners does nothing for dropping the resistances and even some of the fancy filleted geometry in the branching sections is actually useless (see dark blue sections).
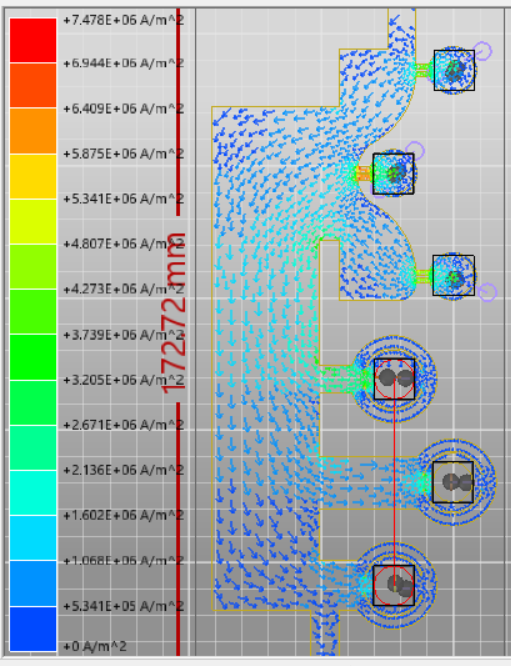
12th version
A whole morning later, we got this:
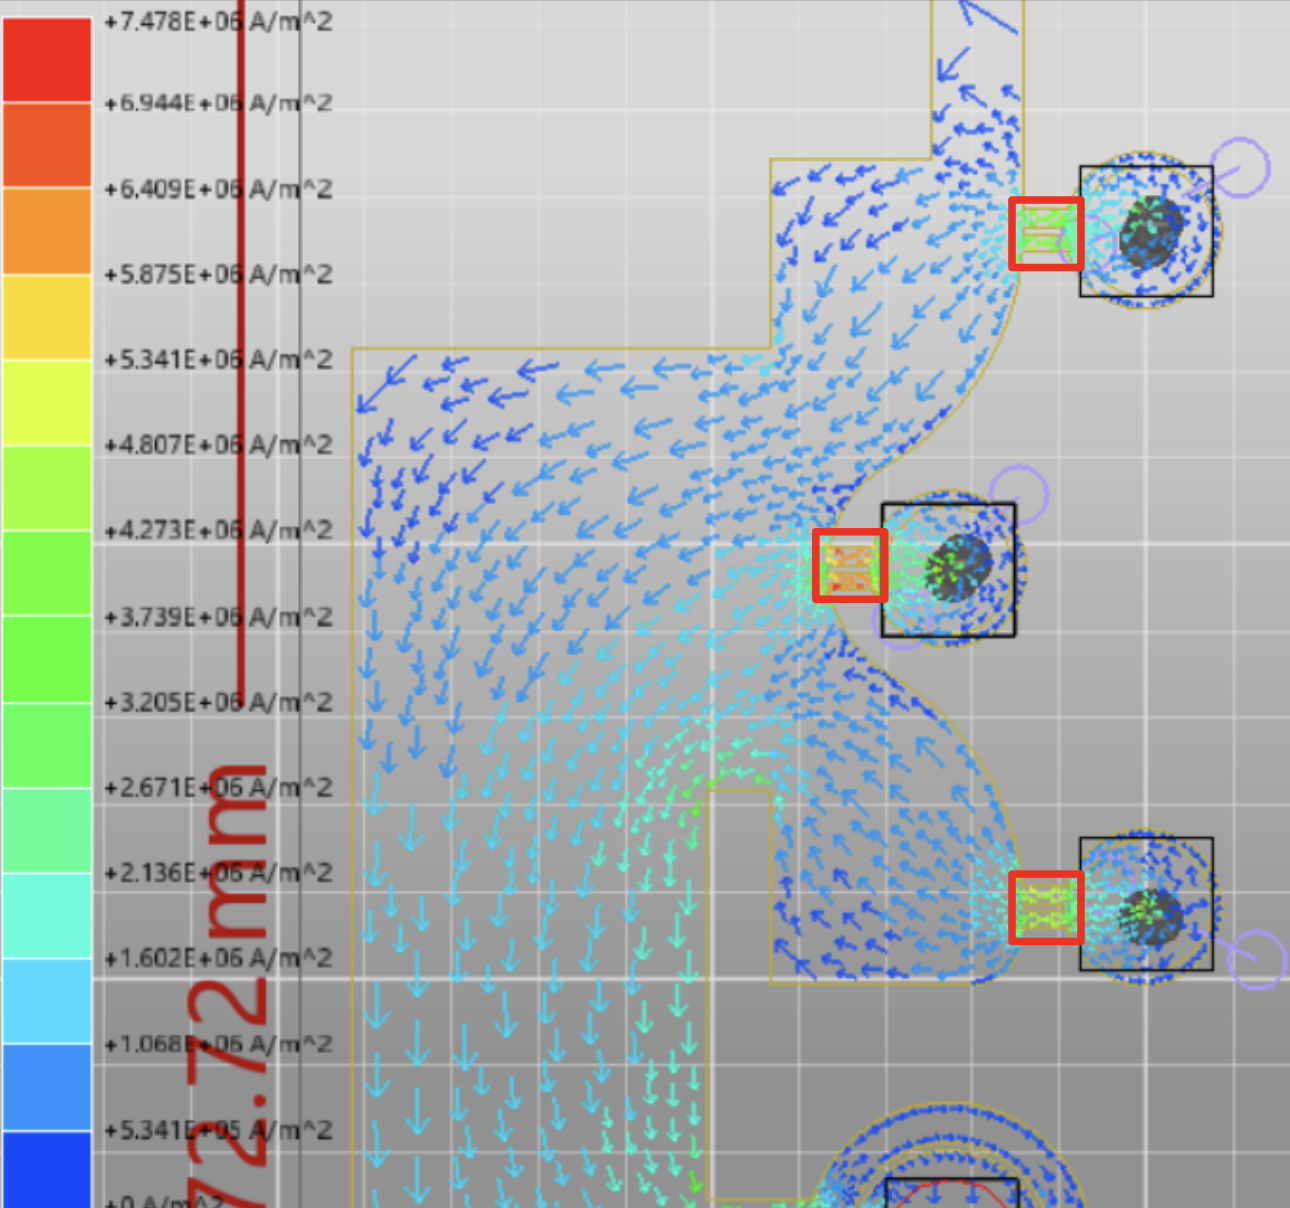
Zooming in:
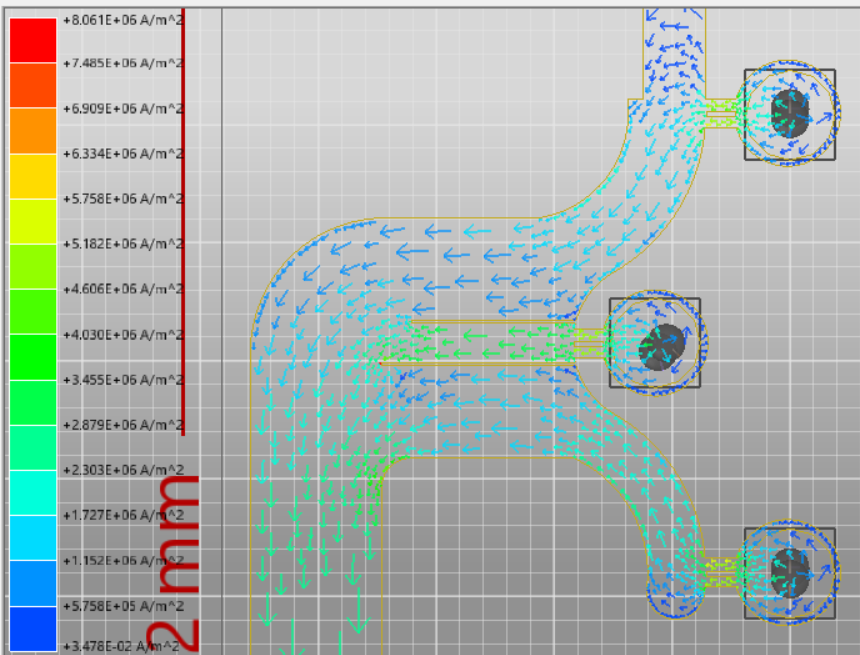
The discharge ratio is roughly 1:1:1, and the fillets actually serve a purpose most of the time (almost no wasted area). The key innovation was those uneven cutouts on the middle tab which restricting funnelling toward the middle, increasing resistance there.
We also got the bottom side to look good, but that’s the same process so skipping that here.
I think this is a pretty valuable use of time, considering it doesn’t take that long and provides assurance that your efficiency won’t suck and your fusible links should work.